
By Roger Coppock
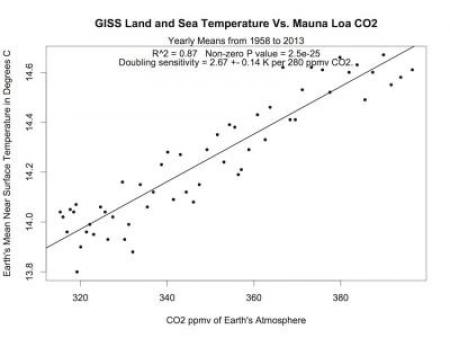
The first article of this series showed that bone dry East County San Diego warmed more than twice as fast as the rest of the globe. ( http://eastcountymagazine.org/why-san-diegos-east-county-global-warming-... ) In this second article, we'll measure the success of past solutions. In the final article of this series, I'll suggest solutions.
Measuring CO2's increase
How do we measure success in the battle against increasing CO2 causing increasing temperatures? The obvious way is to measure the increase of CO2 in our planet's atmosphere. Below is a graph of the Keeling Curve. It's named after Dr. Charles David Keeling, a Geochemist and Oceanographer, who while at San Diego's Scripps Institution of Oceanography started what is now the longest series of direct CO2 measurements available. (See note #1 below.)
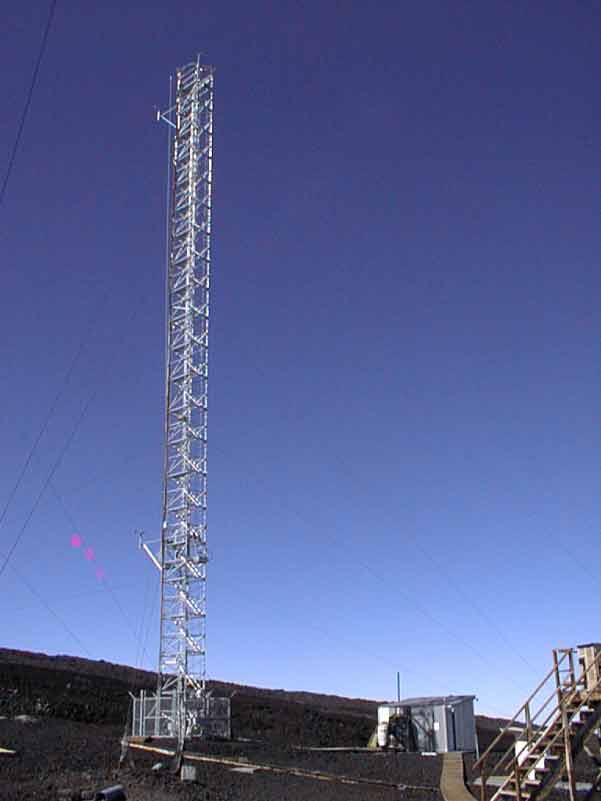
A tower high above the top of mount Mauna Loa in Hawaii scoops air from the trade winds after they've crossed two thousand miles of open ocean. This air sample is free from local contamination, and is therefore a good representation of the background CO2 level of our planet. (Notes #2)
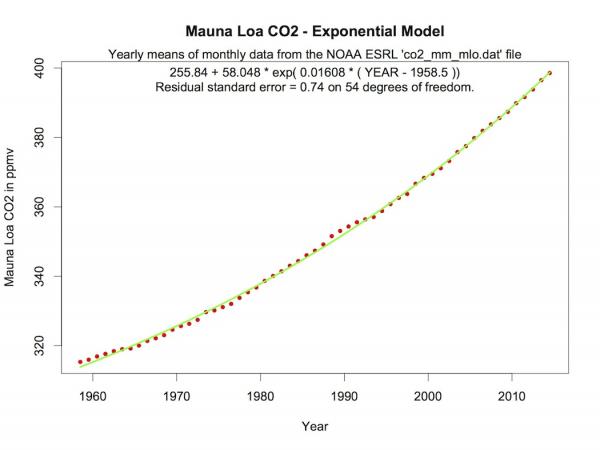
My program put two calculations on the graph. The first, "255.84 + 58.048 * exp( 0.01608 * ( YEAR - 1958.5 ))", is an approximating formula to the Keeling Curve. The second calculation, "Residual standard error = 0.74", is an indication of how close the approximation is to the Keeling Curve's CO2 measurements. The calculation started with the CO2 measurements and a simple exponential formula and then determined the three numbers, 255.84, 58.048, and 0.01608, so that the residual standard error is as small as possible. (Note #3)
The important point here is that the green line approximating formula comes very close to the red dots representing the actual yearly means of the CO2 measurements of air from the top of the tower on Mount Mauna Loa. The red dots and the green line nearly overlap. That is what the second calculation, "Residual standard error = 0.74", is saying.
So, the simple little exponential formula,
![]()
comes very very close to describing the actual yearly mean measurements of CO2 over the last 56 years. Each year mankind puts additional CO2 into our planet's atmosphere, more than nature can use. Methodically, year by year, that accumulates in a very simple pattern. Step by step the CO2 increases each year, with each step likely to be just a little bit bigger than last year's. Nothing has significantly changed this behavior since Dr. Keeling started measuring.
So far, the rhythm is unbroken. If the beat isn't stopped, CO2 is likely to be over 800 parts per million by volume in 2100. (See the table below.) If someone actually did something about the CO2 buildup and greenhouse warming, then there would be a noticeable change. That would be a permanent change from the green colored exponential of more than twice the residual standard error, or 1.5 ppmv. (Three Standard errors, or 2.2 ppmv, or more, pass muster in scientific publications.) Nothing done since the first Earth Day in 1970 has produced any significant change in the global trend. This includes IPCC reports, international meetings, treaties, demonstrations, writings, videos, teach ins, elections, . . . I realize that I commit major heresy with my liberal friends when I say this, but a decade from now we will not look at an updated graph and say, "See that downturn in 2014, that was the year we got together and held a big protest." The environmental movement has got to brainstorm for other tactics, because many of our current ones are a demonstrated waste of time. They need to recognize that, 'We've been there and done that.' Otherwise, my children are doomed to follow this CO2 schedule:
Year CO2 Forcing
ppmv W/m^2
2014 399 +1.90
2040 471 +- 25 +2.8
2050 509 +- 30 +3.2
2060 553 +- 36 +3.6
2070 605 +- 44 +4.1
2080 666 +- 54 +4.6
2090 737 +- 66 +5.2
2100 821 +- 80 +5.8
(Please see note #4)
That, as my T-shirt says, is, "The World Going to Hell, and Speeding Up Getting There."
- - - - N O T E S - - - -
1) http://en.wikipedia.org/wiki/Charles_David_Keeling
http://en.wikipedia.org/wiki/Keeling_Curve
http://www.esrl.noaa.gov/gmd/obop/mlo/
http://www.esrl.noaa.gov/gmd/obop/mlo/programs/coop/ansto/img/img_tower_and_detector_far.JPG
2) Continued data for Keeling's Curve comes from the National Oceanic and Atmospheric Administration's Earth System Research Laboratory. The data are found here:
ftp://aftp.cmdl.noaa.gov/products/trends/co2/co2_mm_mlo.txt
The data file was sampled on 12/05/14.
The Graph of the exponential rise of CO2 was produced by the author with the "R" statistical package. The R statistical package can be found here:
R Core Team (2014). R: A language and environment for statistical computing.
R Foundation for Statistical Computing, Vienna, Austria. URL
There is a known yearly cycle in the Mauna Loa CO2 data. It is explained by the seasons and the differing land areas of the Northern and Southern Hemispheres. However, it is not relevant to this discussion.
3) The 4th number in the formula,1958.5, represents the starting year of the data series. It is subtracted from the variable "YEAR" to increase the accuracy of computation. The Computer Science behind this takes a college semester course to fully explain. Basically, the representations of numbers inside a digital computer are limited representations of the ideal "real numbers" of pure Mathematics. There are nearly an equal number of digital computer "floating point number" representations between +1.0 and -1.0 as there are representations for all other numbers. Therefore, one is more accurate calculating with smaller numbers. Subtracting a constant starting year value from all the years decreases number sizes in the calculation and increases the accuracy of the final result.
4) Standard error differences in the coefficients were used.
The radiative "Forcing" is the amount of energy diverted by the enhanced CO2 greenhouse effect measured in Watts per square meter of the Earth's area. The Earth's surface area is about 510,100,000,000,000 meters squared, ( http://en.wikipedia.org/wiki/Earth ), so these numbers represent a huge amount of energy. The entire world stockpile of nuclear bombs carries less energy than just a few hours of today's 1.9 Watts per meter squared CO2 forcing.
Forcing(CO2)=5.35*log(CO2/InitialCO2); InitialCO2=280ppmv
Formula from IPCC Third Assessment Report. ( http://www.grida.no/climate/ipcc_tar/wg1/222.htm , Table 6.2)


Comments
Roger, Thanks
The purpose of this article
Thanks!!
Citations